Uploads by Jure.Japelj
From Gaia Science Alerts Working Group
Jump to navigationJump to searchThis special page shows all uploaded files.
| Date | Name | Thumbnail | Size | Description | Versions |
|---|---|---|---|---|---|
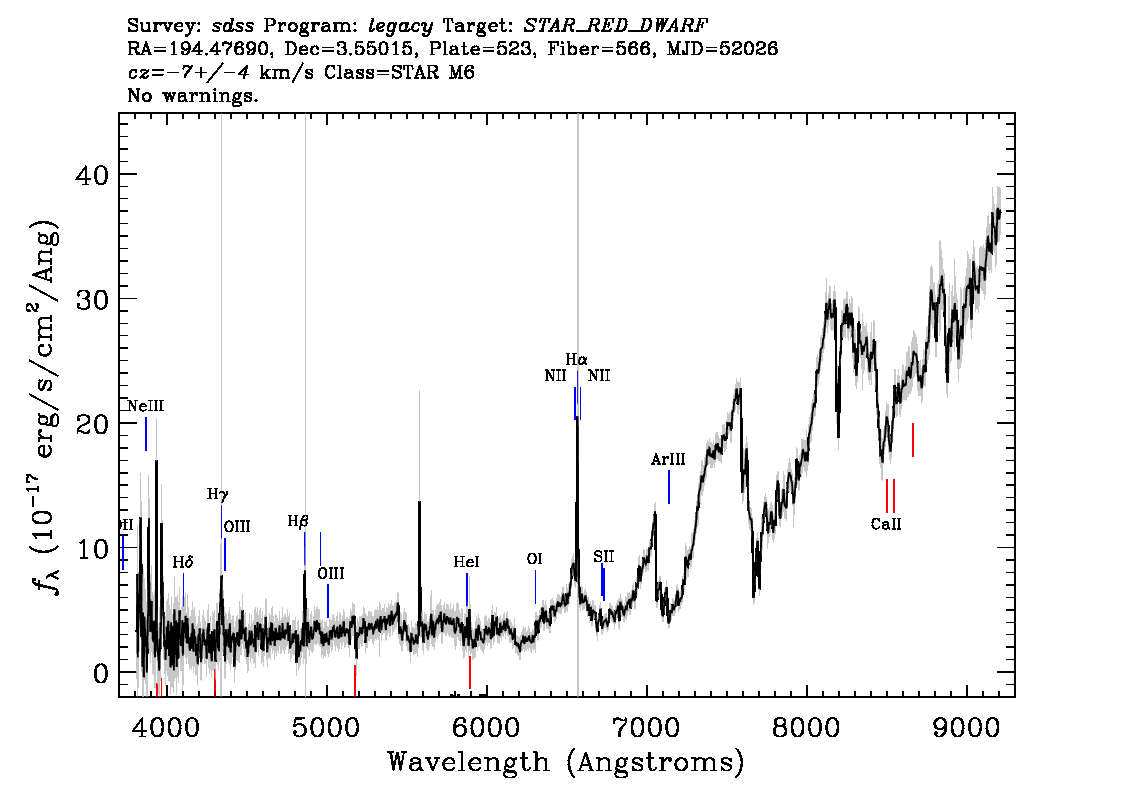
| 14:59, 11 September 2011 | M star spectrum.png (file) |  |
34 KB | 1 | |
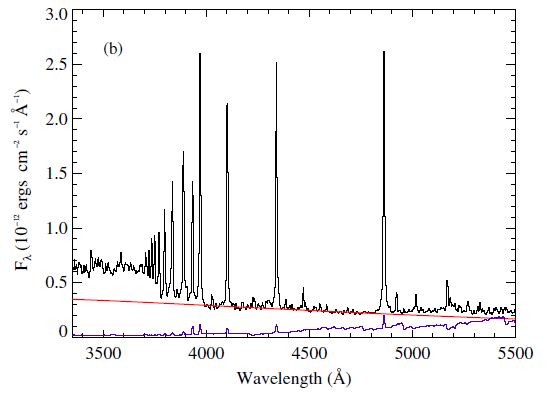
| 10:58, 8 September 2011 | Yzcmi spec.png (file) |  |
19 KB | 1 | |
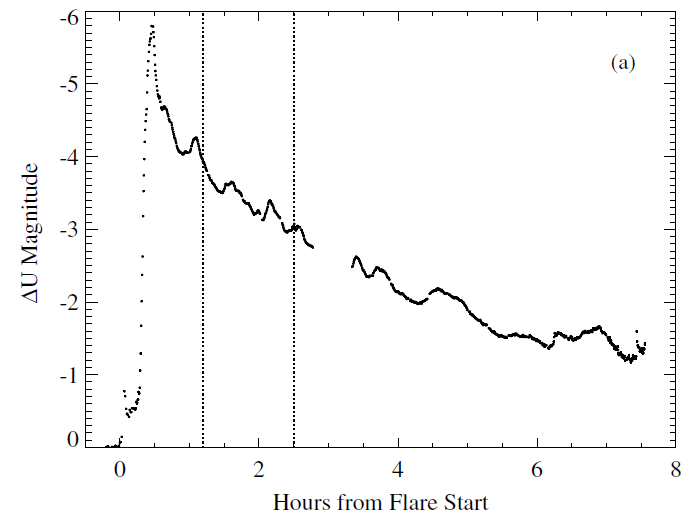
| 10:54, 8 September 2011 | Yzcmi.png (file) |  |
27 KB | 1 | |
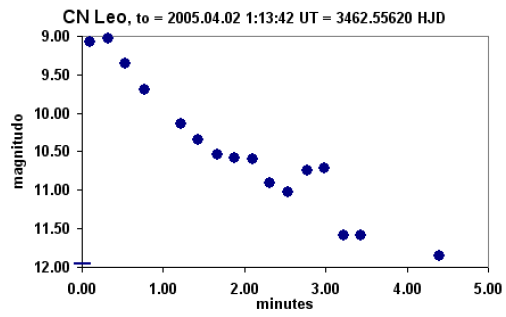
| 10:41, 8 September 2011 | Cn leo.png (file) |  |
24 KB | 1 | |
| 10:36, 8 September 2011 | Uv ceti.png (file) |  |
48 KB | 1 | |
| 10:35, 8 September 2011 | Gj3332.png (file) |  |
12 KB | 1 | |
| 11:02, 15 July 2011 | F10.png (file) |  |
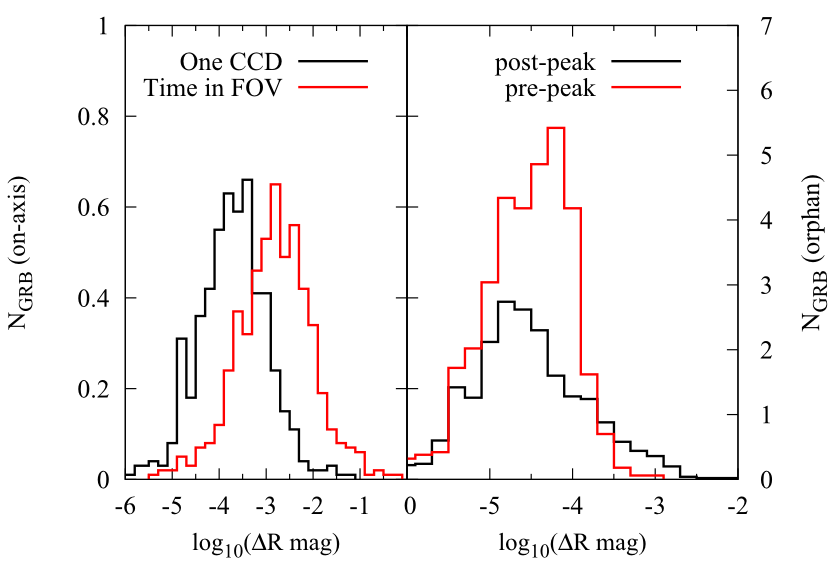
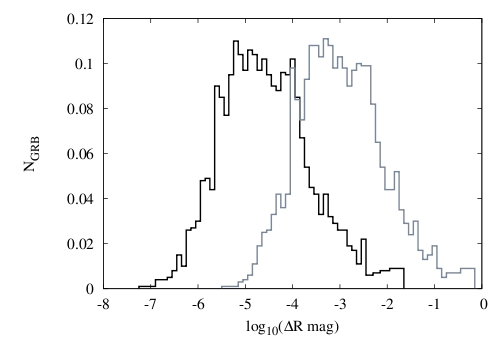
49 KB | Left: Distribution of the change in magnitude in 4.4 s (corresponding to an observation with 2 successive CCDs) (black) and the change of magnitude in the time in which an afterglow is in the entire field of view (red) for the on-axis case. Right: Distrib | 1 |
| 11:01, 15 July 2011 | F6.png (file) |  |
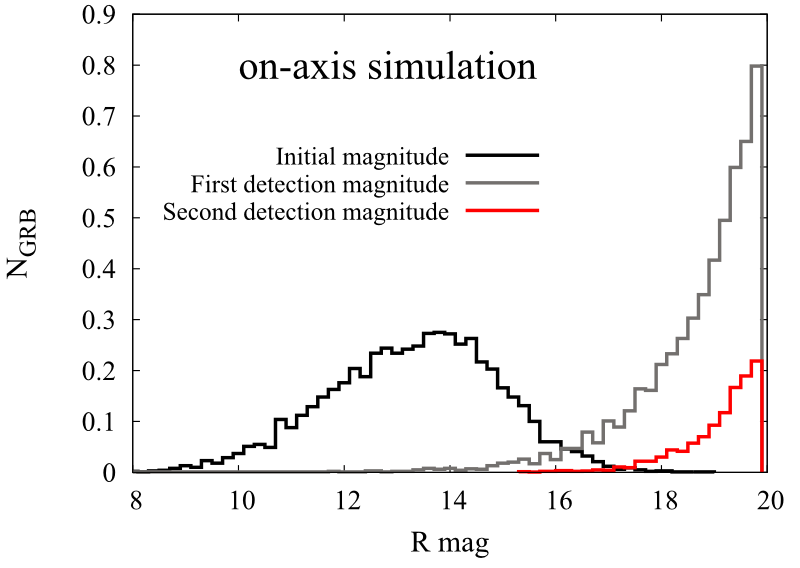
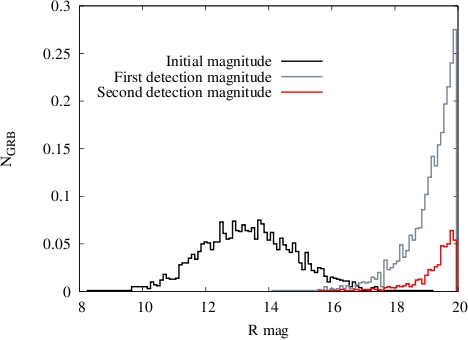
53 KB | Distribution of magnitudes, which are associated with detected afterglows (black), same magnitudes at the time of the first detection (grey) and magnitudes of afterglows detected by the second telescope (red) in the case of on-axis simulation. The results | 1 |
| 11:00, 15 July 2011 | F5.png (file) |  |
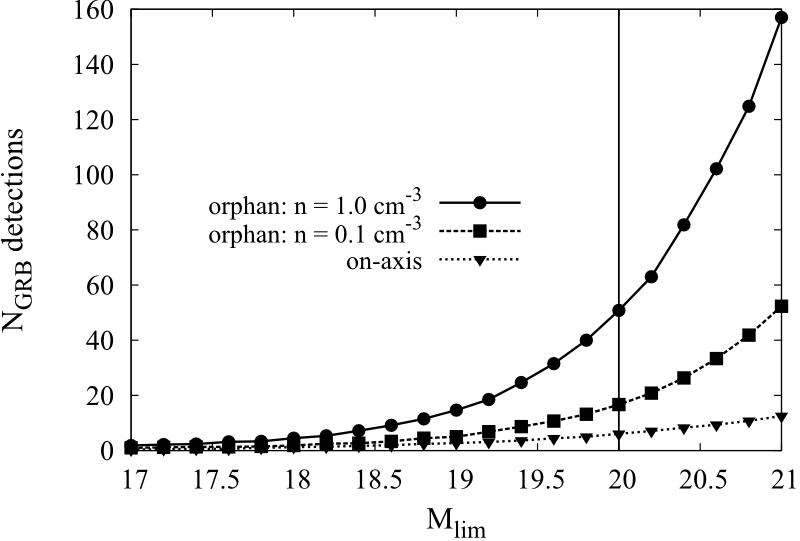
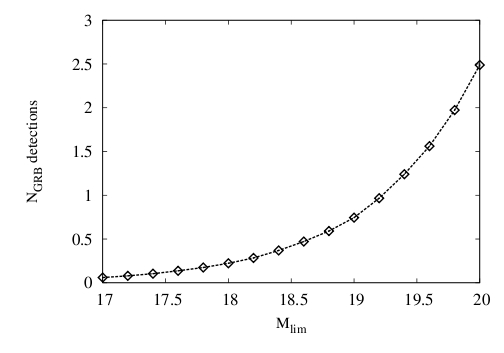
63 KB | GRB on-axis and OAs detection rate in five years of Gaia's operation as a function of limiting magnitude. In the case of OAs, the results are given for two different circumburst environments. | 1 |
| 20:06, 31 March 2011 | Theta2.png (file) |  |
1 KB | 1 | |
| 20:06, 31 March 2011 | Theta1.png (file) | 1 KB | 1 | ||
| 20:05, 31 March 2011 | Thetaobs.png (file) |  |
808 bytes | 1 | |
| 20:02, 31 March 2011 | Theta.png (file) |  |
510 bytes | 1 | |
| 16:38, 31 March 2011 | Report.pdf (file) | 324 KB | Report on the simulation of the detectability of regular 'on-axis' GRB optical afterglows with the Gaia satellite. | 1 | |
| 14:49, 31 March 2011 | F4.jpg (file) |  |
29 KB | Distribution of the change in magnitude in 4.4 s (corresponding to an observation with 2 successive CCDs) (black) and the change during the afterglow presence in the field of view (gray). | 1 |
| 14:48, 31 March 2011 | F3.jpg (file) |  |
35 KB | Distribution of initial magnitudes, which are associated with detected afterglows (black), same magnitudes at the time of the first detection (gray) and magnitudes of afterglows detected also by the second telescope (red). | 1 |
| 14:47, 31 March 2011 | F2.jpg (file) |  |
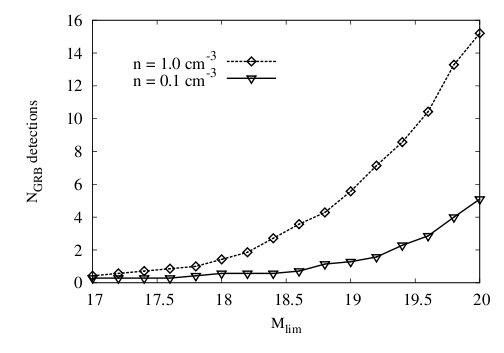
32 KB | The average GRB orphan-afterglow detection rate in five years in the case of two different circumburst environments. | 1 |
| 14:46, 31 March 2011 | F1.jpg (file) |  |
23 KB | The average GRB on-axis afterglow detection rate in five years. | 1 |
| 14:45, 31 March 2011 | Kann.png (file) |  |
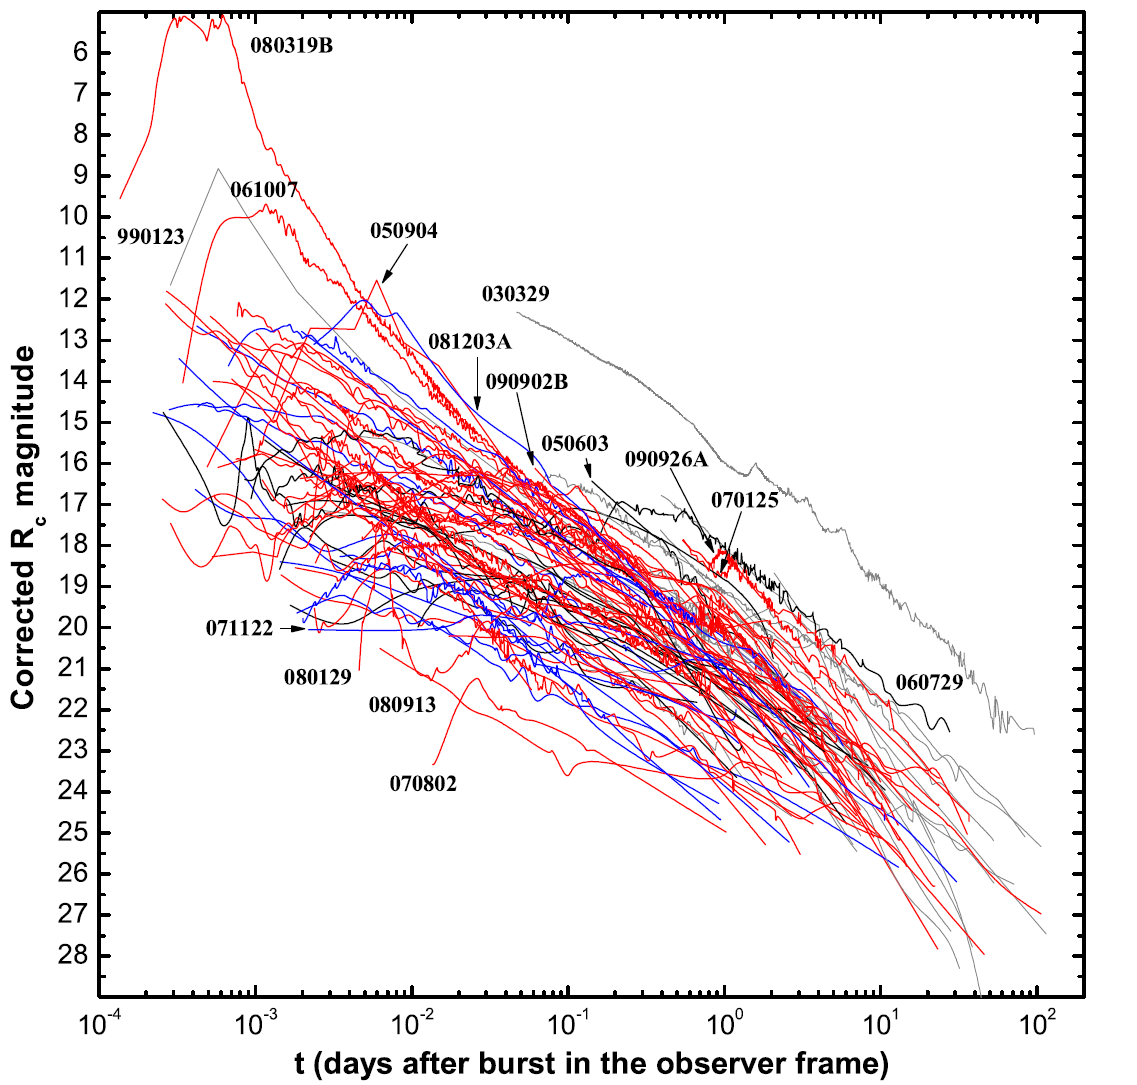
362 KB | A large sample of regular (on-axis) optical afterglow lightcurves, corrected for Galactic extinction. | 1 |
| 10:20, 31 March 2011 | F1.pdf (file) | 8 KB | 2 | ||
| 18:52, 30 March 2011 | Kann afterglow1.pdf (file) | 232 KB | A large sample of regular (on-axis) optical afterglow lightcurves, corrected for Galactic extinction. | 1 | |
| 18:50, 30 March 2011 | Kann afterglow.pdf (file) | 232 KB | A large sample of regular (on-axis) optical afterglow lightcurves, corrected for Galactic extinction. | 3 |