File:F10.png
From Gaia Science Alerts Working Group
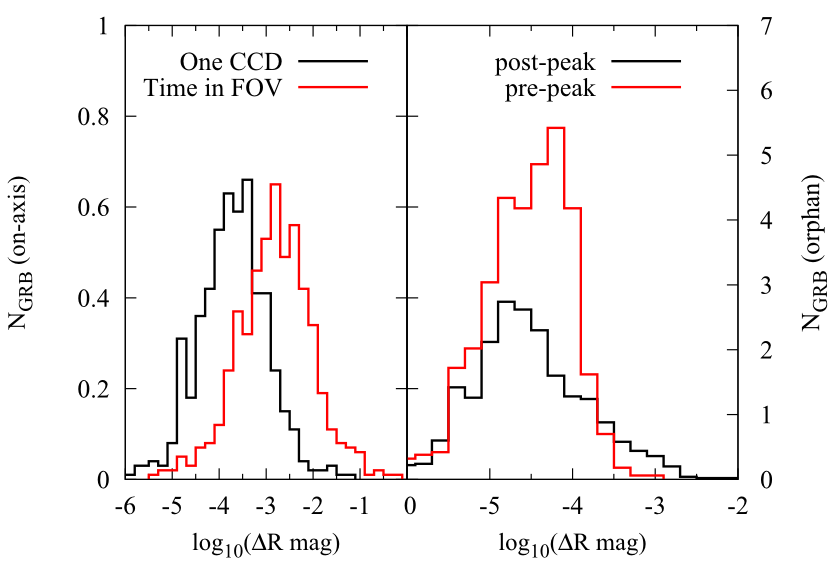
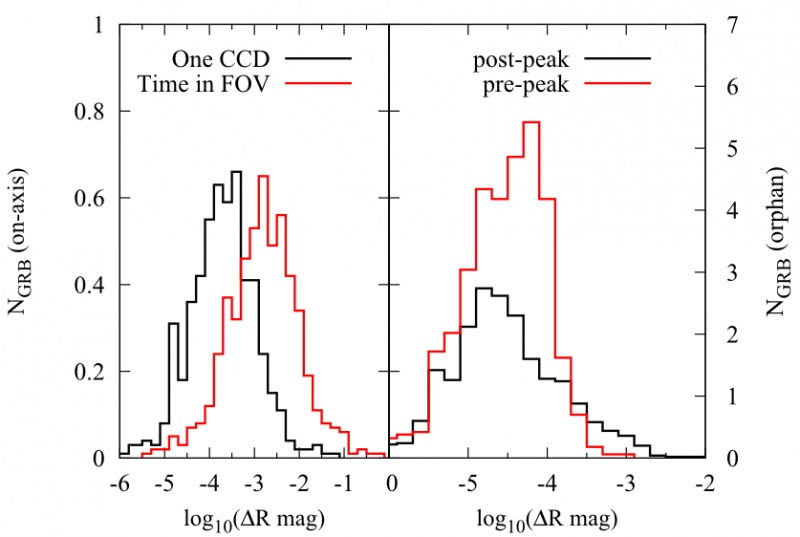
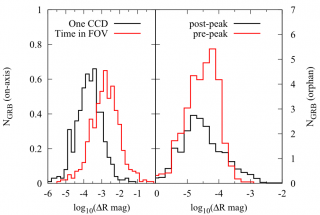
Revision as of 11:02, 15 July 2011 by Jure.Japelj (talk | contribs) (Left: Distribution of the change in magnitude in 4.4 s (corresponding to an observation with 2 successive CCDs) (black) and the change of magnitude in the time in which an afterglow is in the entire field of view (red) for the on-axis case. Right: Distrib)
Size of this preview: 800 × 537 pixels. Other resolutions: 320 × 215 pixels | 837 × 562 pixels.
Original file (837 × 562 pixels, file size: 49 KB, MIME type: image/png)
Left: Distribution of the change in magnitude in 4.4 s (corresponding to an observation with 2 successive CCDs) (black) and the change of magnitude in the time in which an afterglow is in the entire field of view (red) for the on-axis case. Right: Distribution of the change in magnitude in the time in which an orphan afterglow is in the field of view. Black distribution corresponds to detection after the peak in a lightcurve while red distribution corresponds to detection before the peak.
File history
Click on a date/time to view the file as it appeared at that time.
| Date/Time | Thumbnail | Dimensions | User | Comment | |
|---|---|---|---|---|---|
| current | 11:02, 15 July 2011 | | 837 × 562 (49 KB) | Jure.Japelj (talk | contribs) | Left: Distribution of the change in magnitude in 4.4 s (corresponding to an observation with 2 successive CCDs) (black) and the change of magnitude in the time in which an afterglow is in the entire field of view (red) for the on-axis case. Right: Distrib |
You cannot overwrite this file.
File usage
The following page uses this file: